
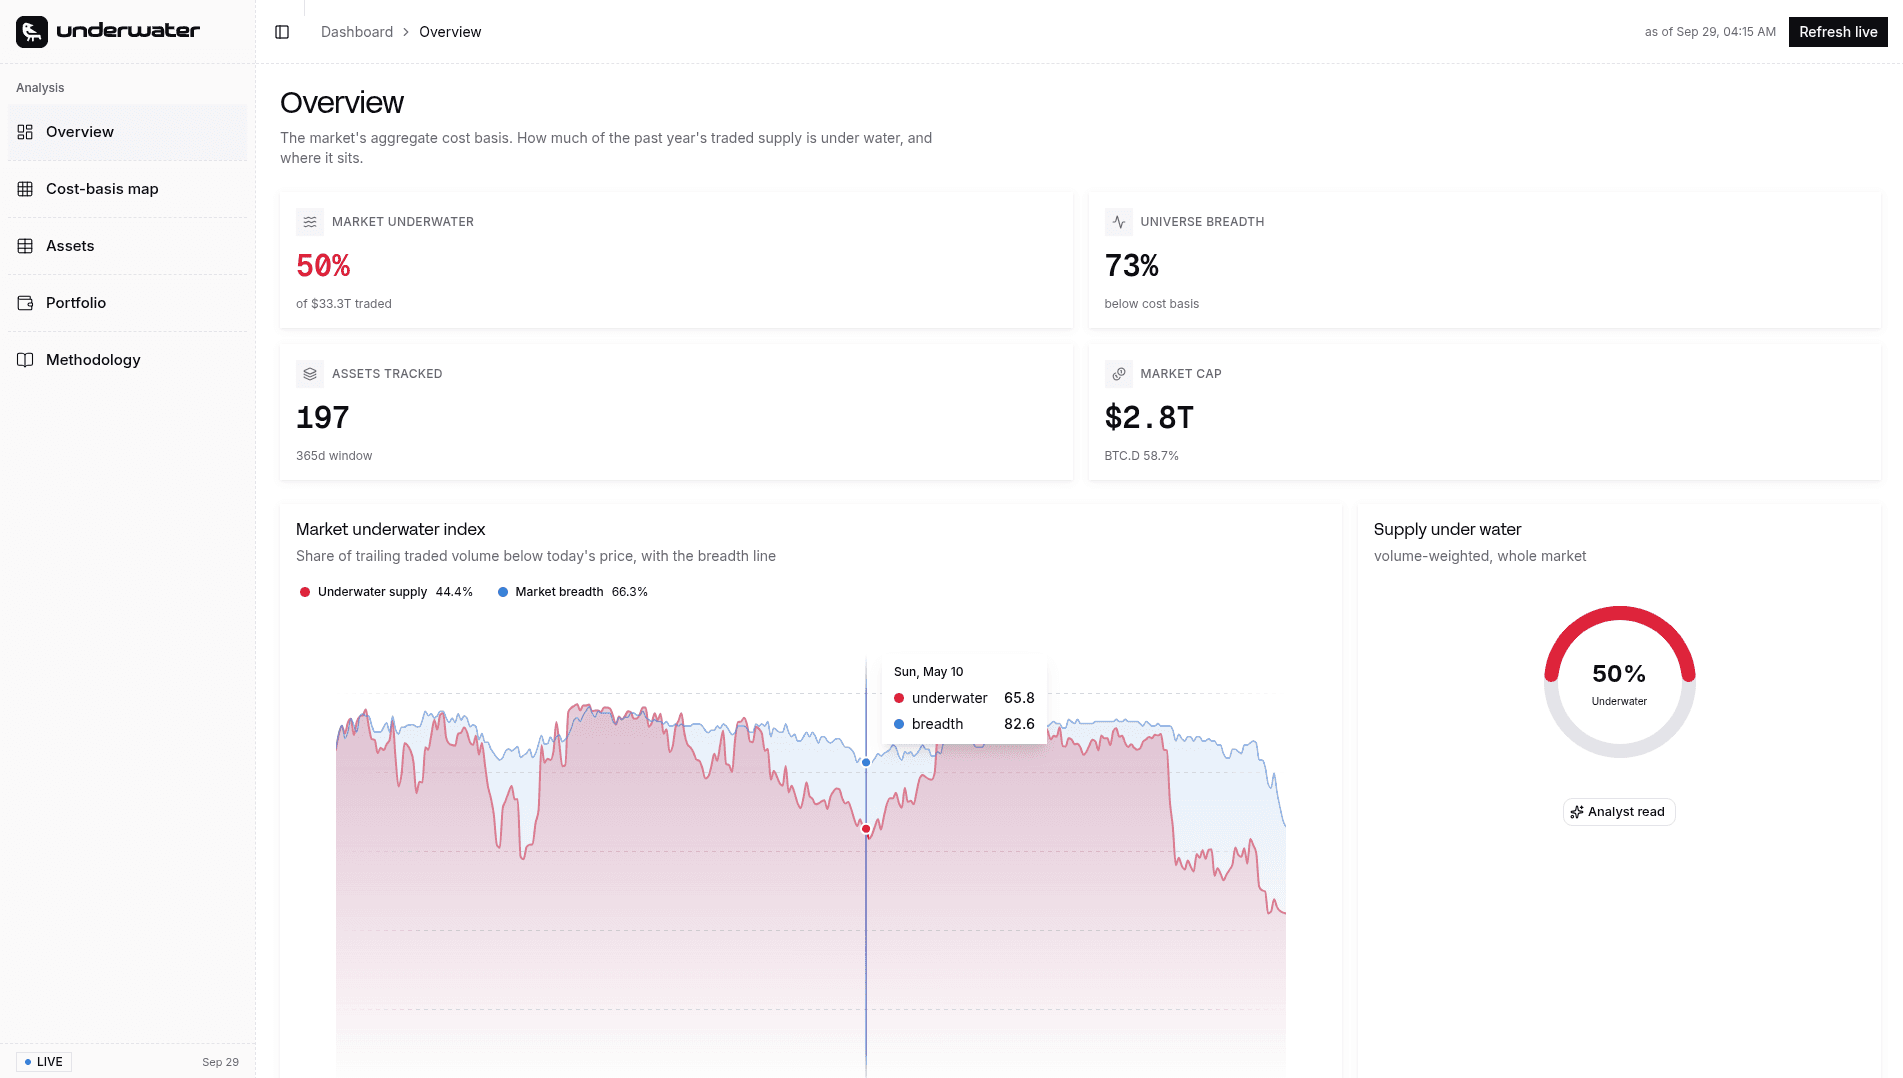
Market Underwater Index
One trailing oscillator for the whole market. It tracks the share of traded volume sitting below today's price, with a breadth line and a Fear and Greed overlay.

The hidden cost basis of 200 crypto assets, and the supply waiting to break even.
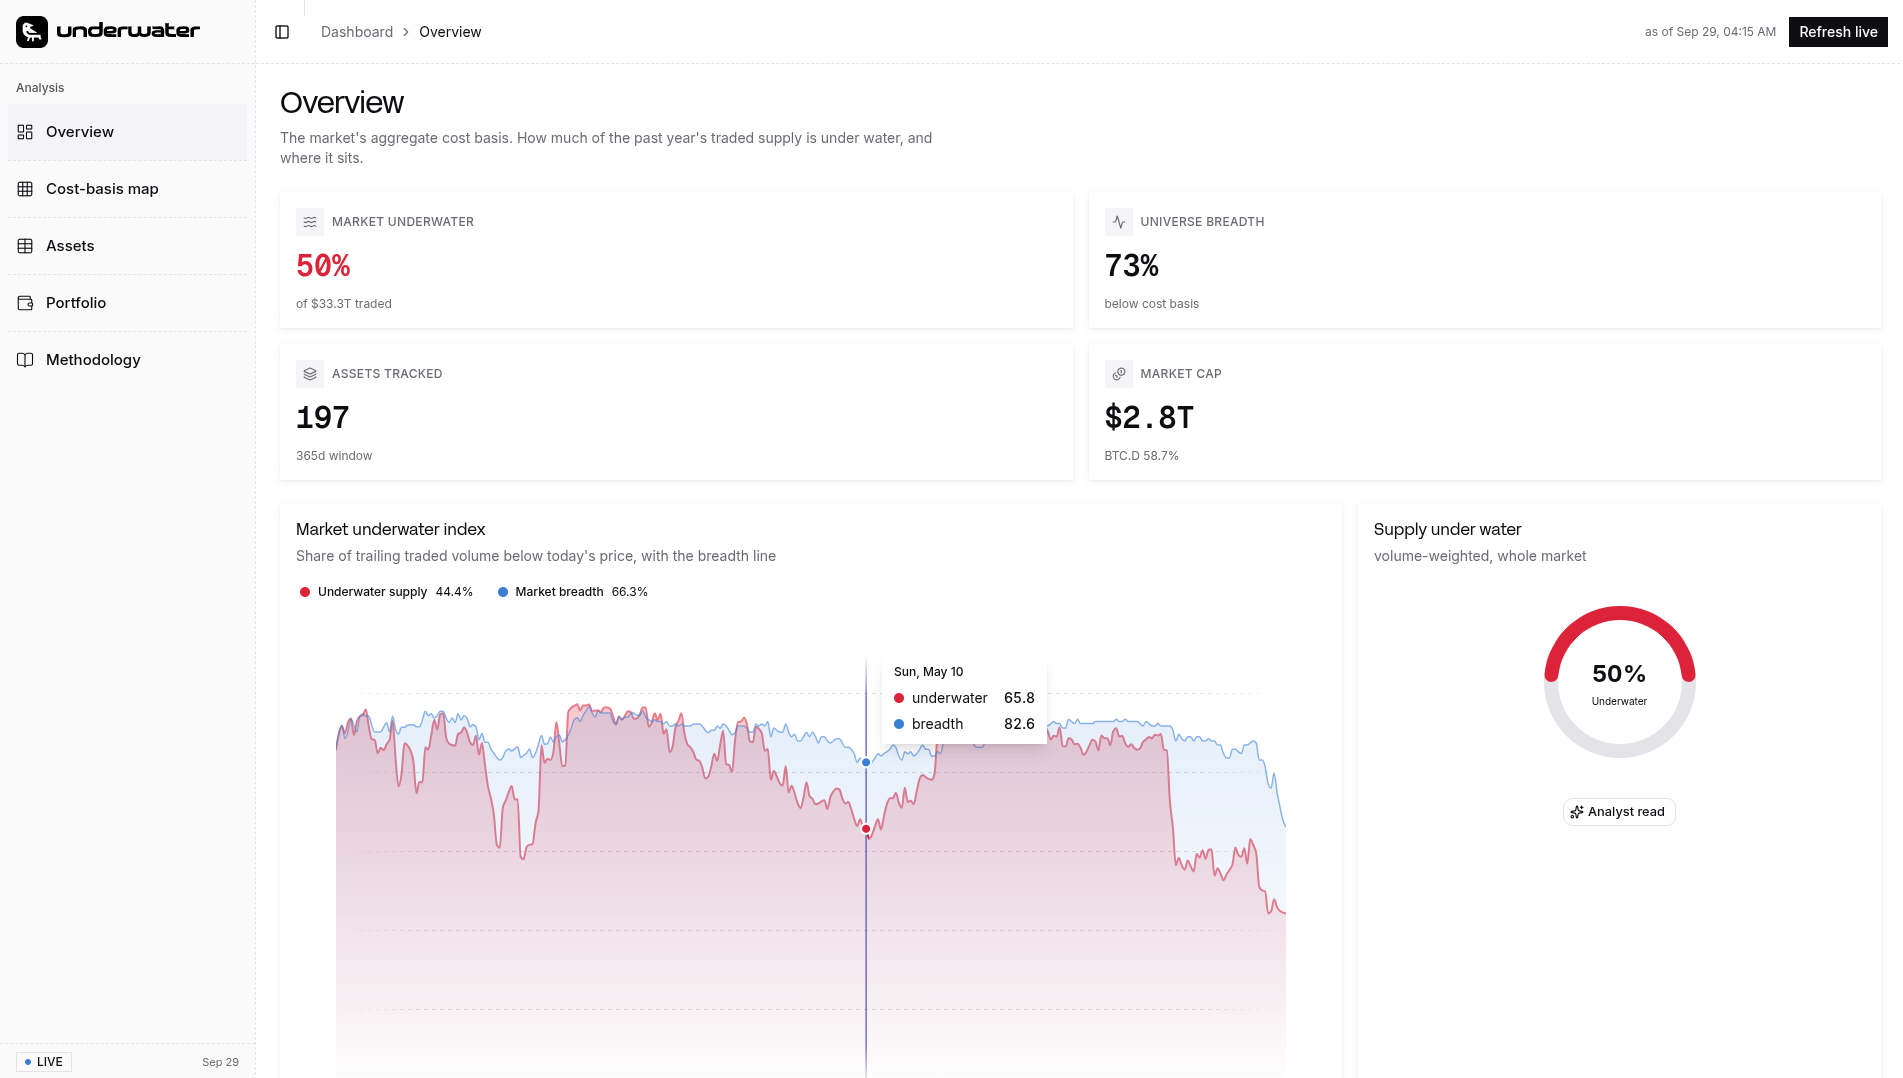
One trailing oscillator for the whole market. It tracks the share of traded volume sitting below today's price, with a breadth line and a Fear and Greed overlay.
Every asset placed by price against cost basis, and by how much of its volume is underwater.
Search, filter, and sort the universe by underwater supply.
Open any asset to see exactly where the year's volume traded, plotted against the current price.
Paste a portfolio and read its value-weighted cost basis, plus where the pain is concentrated.
Pull a fresh universe straight from the CoinMarketCap API.

Every asset has a deep link, so you can send one chart or your whole view.

01
Privacy and Gaming carry the heaviest overhang, at 84% and 78% underwater.
02
ZEC and HYPE trade above almost all of the year's cost basis.
03
DOGE holders sit on an average loss of 31%.
04
Half of a year of traded volume is trapped, and that is latent sell pressure.
Explore the underwater index, the cost-basis map, and your own portfolio in seconds.

